18  Visualizations

Yun-Tien Lee and Alec Loudenback

Graphical excellence is that which gives to the viewer the greatest number of ideas in the shortest time with the least ink in the smallest space. - Edward Tufte, 2001

18.1 Chapter Overview

The evolved brain and pattern recognition, a general guide for creating and iterating on visualizations, and principles for creating good visualizations while avoiding common mistakes.

18.2 Introduction

Visualization is a cornerstone of data analysis, statistical modeling, and decision-making. It transforms raw data into something we can see and understand, making it easier to uncover patterns, communicate ideas, and make informed decisions.

The human brain can only parse a relatively small number of textual datapoints at a single time. We are incredibly visual creatures, with our brains able to process visually many orders of magnitude more information per second than through text.

Consider the following example of tabular data, with four sets of paired \(x\) and \(y\) coordinates.

using DataFrames

# Define the Anscombe Quartet data
anscombe_data = DataFrame(
    x1=[10.0, 8.0, 13.0, 9.0, 11.0, 14.0, 6.0, 4.0, 12.0, 7.0, 5.0],
    y1=[8.04, 6.95, 7.58, 8.81, 8.33, 9.96, 7.24, 4.26, 10.84, 4.82, 5.68],
    x2=[10.0, 8.0, 13.0, 9.0, 11.0, 14.0, 6.0, 4.0, 12.0, 7.0, 5.0],
    y2=[9.14, 8.14, 8.74, 8.77, 9.26, 8.10, 6.13, 3.10, 9.13, 7.26, 4.74],
    x3=[10.0, 8.0, 13.0, 9.0, 11.0, 14.0, 6.0, 4.0, 12.0, 7.0, 5.0],
    y3=[7.46, 6.77, 12.74, 7.11, 7.81, 8.84, 6.08, 5.39, 8.15, 6.42, 5.73],
    x4=[8.0, 8.0, 8.0, 8.0, 8.0, 8.0, 8.0, 19.0, 8.0, 8.0, 8.0],
    y4=[6.58, 5.76, 7.71, 8.84, 8.47, 7.04, 5.25, 12.50, 5.56, 7.91, 6.89]
)
11×8 DataFrame
Row x1 y1 x2 y2 x3 y3 x4 y4
Float64 Float64 Float64 Float64 Float64 Float64 Float64 Float64
1 10.0 8.04 10.0 9.14 10.0 7.46 8.0 6.58
2 8.0 6.95 8.0 8.14 8.0 6.77 8.0 5.76
3 13.0 7.58 13.0 8.74 13.0 12.74 8.0 7.71
4 9.0 8.81 9.0 8.77 9.0 7.11 8.0 8.84
5 11.0 8.33 11.0 9.26 11.0 7.81 8.0 8.47
6 14.0 9.96 14.0 8.1 14.0 8.84 8.0 7.04
7 6.0 7.24 6.0 6.13 6.0 6.08 8.0 5.25
8 4.0 4.26 4.0 3.1 4.0 5.39 19.0 12.5
9 12.0 10.84 12.0 9.13 12.0 8.15 8.0 5.56
10 7.0 4.82 7.0 7.26 7.0 6.42 8.0 7.91
11 5.0 5.68 5.0 4.74 5.0 5.73 8.0 6.89

Something not obvious by looking at the tabular data above is that each set of data has the same summary statistics. That is, the four sets of data are all described by the same linear features.

using Statistics, Printf
let d = anscombe_data
    map([[:x1, :y1], [:x2, :y2], [:x3, :y3], [:x4, :y4]]) do pair
        x, y = eachcol(d[:, pair])

        # calculate summary statistics
        mean_x, mean_y = mean(x), mean(y)
        intercept, slope = ([ones(size(y)) x] \ y)
        correlation = cor(x, y)

        (; mean_x, mean_y, intercept, slope, correlation)
    end |> DataFrame
end
4×5 DataFrame
Row mean_x mean_y intercept slope correlation
Float64 Float64 Float64 Float64 Float64
1 9.0 7.50091 3.00009 0.500091 0.816421
2 9.0 7.50091 3.00091 0.5 0.816237
3 9.0 7.5 3.00245 0.499727 0.816287
4 9.0 7.50091 3.00173 0.499909 0.816521

Analytical summarization alone is not enough to understand the data. We need to visualize the data to see the patterns emerge, wherein each of the four datasets tells a very different story:

using CairoMakie


# Create the plots
fig = Figure(resolution=(800, 800))

ax1 = Axis(fig[1, 1], title="Dataset 1")
scatter!(ax1, anscombe_data.x1, anscombe_data.y1)
lines!(ax1, 2:14, x -> 3 + 0.5x, color=:red)

ax2 = Axis(fig[1, 2], title="Dataset 2")
scatter!(ax2, anscombe_data.x2, anscombe_data.y2)
lines!(ax2, 2:14, x -> 3 + 0.5x, color=:red)

ax3 = Axis(fig[2, 1], title="Dataset 3")
scatter!(ax3, anscombe_data.x3, anscombe_data.y3)
lines!(ax3, 2:14, x -> 3 + 0.5x, color=:red)

ax4 = Axis(fig[2, 2], title="Dataset 4")
scatter!(ax4, anscombe_data.x4, anscombe_data.y4)
lines!(ax4, 2:14, x -> 3 + 0.5x, color=:red)

fig
Warning: Found `resolution` in the theme when creating a `Scene`. The `resolution` keyword for `Scene`s and `Figure`s has been deprecated. Use `Figure(; size = ...` or `Scene(; size = ...)` instead, which better reflects that this is a unitless size and not a pixel resolution. The key could also come from `set_theme!` calls or related theming functions.
@ Makie ~/.julia/packages/Makie/ux0Te/src/scenes.jl:238

This dataset is known as Anscombe’s Quartet and is a famous statistical example which is used here to underscore the importance of visualization when seeking to understand or communicate data. However, there are more reasons to refine your experience in the art and science of data visualization which we list in Table 18.1.

Table 18.1: A list of reasons to practice the art and science of data visualization.
Purpose Description
Simplify Complexity Raw data can be overwhelming, especially with large datasets or many variables. A single visualization can convey thousands of points of data into a clear picture.
Reveal Patterns and Relationships Some insights are hidden in plain sight until you visualize them, such as the relationships in the Anscombe’s Quartet example.
Support Better Decisions Understanding patterns and relationships can then translate into better decision making, such as highlighting trends or risks at a glance.
Communicate Effectively Conveying information to others in a visual manner is one of the most effective way at aiding in understanding. The best visualizations don’t just inform— they tell a story that’s useful for understanding and decision making
Encourage Exploration Visual exploration is at the heart of understanding data, uncovering distributions, relationships, or unusual patterns before diving into formal models.

Visualization isn’t just about making data look pretty—it’s about making it useful. Whether you’re exploring data for the first time, presenting findings to stakeholders, or refining a model, good visualizations are essential tools for turning information into insight.

18.3 Developing Visualizations

How does one develop effective visualizations? While a specialty all it’s own, we present the following considerations when creating quantitative displays of visual information. Consider this a guide of ‘how’ to create visualizations of data.

18.3.1 Define Your Message

  • Clarify the Objective: Start with a clear purpose. What is the key insight you want to communicate? Whether it’s forecasting trends, assessing risk, analyzing variances, or comparing financial scenarios, your visualization should be laser-focused on delivering that message, stripping out unnecessary details.
  • Know Your Audience: Tailor every aspect of your visualization to the needs and expertise of your audience. For financial professionals or actuaries, this means ensuring that the visual elements align with their analytical requirements and technical proficiency.

18.3.2 Emphasize Accuracy and Integrity

  • Maintain Consistent Scales: Ensure axes are uniformly scaled and proportional to avoid misleading interpretations. For instance, when showing growth rates or volatility, avoid truncating or exaggerating axes. Consider using logarithmic axes when plotting growth or exponential relationships.
  • Think about human perception of the shapes. For example:
    • We have a hard time comparing arc distances compared to linear distances, so pie charts are almost always a bad idea.
    • When using area to convey data (such as the size of a circle), note that the area scales quadratically, so small changes in diameter can lead to large perceptual differences in area.
  • Data-Driven Design: Strip away unnecessary decorative elements. Every visual component should serve the core purpose of guiding interpretation based on the data.

18.3.3 Prioritize Clarity Over Complexity

  • Simplify Graphics: Use straightforward charts, clean lines, and precise labels. Avoid embellishments that detract from the data’s message such as color variation for aesthetics’ sake.
  • Eliminate “Chartjunk”: Remove distracting elements like excessive gridlines, complex legends, or overly varied colors. Each element should have a clear role in supporting the narrative.
  • Leverage White Space: Thoughtful use of white space can help separate key elements and make comparisons more intuitive.

18.3.4 Organize Data Thoughtfully

  • Decompose Complexity: When dealing with multi-variable or time-series data, consider breaking it into small multiples or related charts for side-by-side comparison.
  • Layered Information: Combine related datasets (e.g., financial performance vs. risk exposure), but ensure each layer is visually distinct and does not obscure others.
  • Provide Multiple Views: Offer both high-level summaries for quick insights and detailed views for deeper analysis.

18.3.5 Enhance Readability

  • Clear Annotations: Label axes, data points, and key takeaways explicitly. Use annotations to highlight critical insights, such as shifts in trends or activation of risk triggers.
  • Consistent Design Elements: Stick to legible fonts and cohesive color schemes. For example, use consistent colors across charts to represent comparable data points for easier pattern recognition.

18.3.6 Validate and Iterate

  • Test for Clarity: Share your visuals with peers or stakeholders to ensure they are interpreted as intended. Feedback can help identify areas of confusion or misrepresentation.
  • Iterate Continuously: Treat visualization design as an evolving process. Refine layouts, scales, and annotations based on feedback and changing analytical needs.

Effective financial visualizations are built on clarity, accuracy, and thoughtful organization. By adhering to these principles—streamlined design, data integrity, and iterative refinement—you can transform complex datasets into actionable insights that empower decision-making in financial modeling and actuarial work.

Tip

Most financial modelers are familiar with putting together plots in Excel….

18.3.7 Example: Improving a Disease Funding Visualization

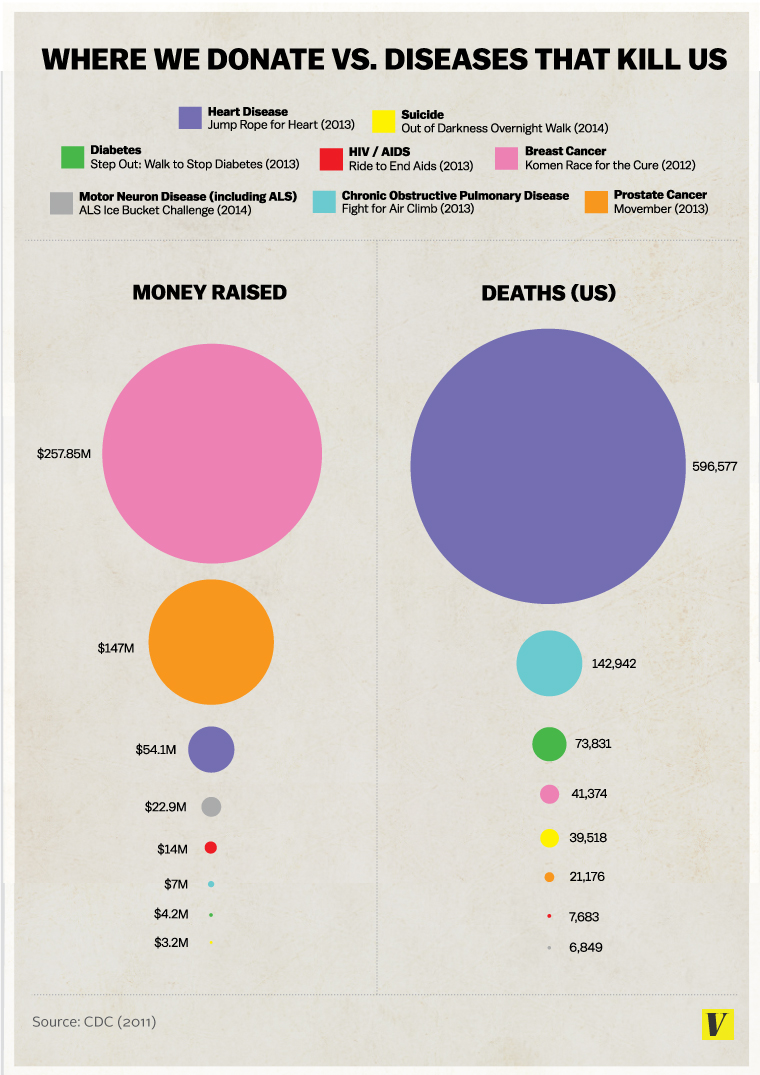
We will take a visualization (?fig-vox-plot) which has a number of issues and apply some of the principles above to improve the communication.

This example was found via (Schwarz 2016), which also identifies several of the following issues with the graphic:

  • Misleading Circle Areas: Using circle diameters to represent values distorts perception because people intuit a comparison of area, not diameter. This results in misleading comparisons, such as the area for Breast Cancer funds appearing four times larger than Prostate Cancer, despite being only twice the value.
  • Data Dimensionality: There are two dimensions of data conveyed: deaths and funding, while it’s presented with four degrees of variation: (1) color, (2) vertical ranking, (3) horizontal categorization, and (4) bubble size.
  • Labeling Issue: Disease names should be placed directly on circles to improve readability and assist color-blind individuals.
  • Comparison Clarity: To effectively compare funds raised to deaths caused, these metrics should be displayed side-by-side or connected with lines.
  • Precision Overload: Excessive precision in numerical data, such as using eight digits for funds raised, is unnecessary and can confuse interpretation.
  • Missing Data Label: The graph omits a label for the last dollar amount, likely related to Diabetes, which could be avoided by labeling directly on the graph.

Vox Media Infographic that inappropriately and ineffectively conveys data. From Vox Media (Accessed via Archive.org) (Matthews 2014). {#fig-vox-plot}

In this revised version, we take the data as accurate and simply recast the visualization of the data. The revised plot takes the following steps:

  • Use a simpler 2D scatterplot mirroring the two dimensional data.
  • Eliminate unnecessary color and let the labels themselves sit within the plot to avoid the eye needing to jump between the legend and the datapoints.
  • Remove precision in the axis ticks, since decimal level precision is not necessary to tell the story.
  • Remove unnecessary plot elements including gridlines and axes without tick labels.
using CairoMakie

# Data
diseases = ["Breast Cancer", "Prostate Cancer", "Heart Disease", "Motor Neuron/ALS",
    "HIV / AIDS", "Chronic Obstructive Pulmonary Disease", "Diabetes", "Suicide"]
money_raised = [257, 147, 54.1, 22.9, 14, 7, 4.2, 3.2]
deaths_us = [41.374, 21.176, 596.577, 6.849, 7.683, 142.942, 73.831, 39.518]

# Create the scatter plot
fig = Figure()
ax = Axis(
    fig[1, 1],
    xlabel="Annual Money Raised (\$millions)",
    ylabel="Annual Deaths in US (thousands)",
    limits=(0, 350, -30, 770),
    xgridvisible=false,
    ygridvisible=false,
)
hidespines!(ax, :t, :r)
scatter!(ax, money_raised, deaths_us)

# Annotate each point with the disease name
for (i, disease) in enumerate(diseases)
    # avoid overlapping labels
    offset = if disease == "Motor Neuron/ALS"
        (0, -15)
    else
        (3, 2)
    end
    text!(ax, money_raised[i], deaths_us[i], text=disease, fontsize=12, offset=offset)
end

# Display the plot
fig

From the revised plot, a few key insights emerge naturally and immediately:

  • The cancers receive outsized funding relative to the deaths caused.

  • Heart disease remains an outsized killer compared to all other causes of death present.

And it raises some interesting questions:

  • Is there an inverse relationship between the perceived “control” one has over a disease and how much funding people are willing to allocate to a cause?

  • Given the wide dispersion in funding, does it matter? How does funding correlate with progress? E.g. has there been faster progress in extending lifespan from avoiding cancer deaths than other diseases?

The new visualization is easier to understand and draw comparisons. From the clarity, relationships are revealed and the visualizations itself reveals interesting followup questions and suggests follow-on analysis to be performed.

18.4 Principles of Good Visualization

Extending the above “how”, we now present the “what”; principles of good visualization (some elements taken from (Tufte 2001)):

  • Clearly represent the data without distortions of size or space.
    • Refrain from clipping axes.
    • Do not rely on features such as shape area unless you have fully considered how viewers perceive them.
  • Utilize variations of features to represent data dimensionality with purpose.
    • If colors vary in a plot, the different colors should have meaning.
    • Don’t jump to a 3D plot - use variations in marker/line styles or small multiples to convey higher dimensions.
  • Encourage the eye to compare different pieces of data.
  • Reveal the data at several levels of detail, from a broad overview to the fine structure.
    • Instead of summary statistics, try plotting all of the data with reduced transparency and let the viewer draw summary conclusions.
  • Maintain consistency throughout the exhibit.
    • Any change in font, color, size, weight, etc. can be interpreted as an intentional choice that the viewer will try to interpret - don’t overburden the viewer.
  • Serve a reasonably clear purpose: description, exploration, tabulation, or decoration and cut out what’s not purposeful.
    • Maximize the data to ink ratio.

18.5 Types of visualization tools

While not an exhaustive list by any means, we take a brief tour through some very common plots and the associated Julia code.

Note

In several of the examples, we could go further to abide by the previously listed principles of good visualizations, such as removing unnecessary gridlines or chart elements. Here, the intention is to provide a sense of how these types of plots might be constructed programmatically. Therefore, we seek not just to streamline the plots themselves, but to also ensure that the code examples are simple and understandable.

  • Basic Charts and Graphs: Bar charts, line graphs, scatter plots, histograms, pie charts.
    • Bar charts are best for comparing categorical data or discrete values across different categories. Sometimes categories can be grouped for a stacked bar chart to show for example how each category changes over time.
    • Line graphs are best for showing trends over time or when we want to highlight the rate of change. It is very intuitive to use line graphs to track trends or patterns.
    • Scatter plots are best for showing relationships or correlations between two variables. It is used a lot when one looks for patterns, clusters or outliers, or would like to explore the distribution of data points across different dimensions.
    • Histograms are best for showing the distribution of a single continuous variable, or visualizing the distribution of data points across different ranges or intervals.
using Random, CairoMakie

# Data for the plots
categories = ["Product A", "Product B", "Product C", "Product D"]
sales = [150, 250, 200, 300]  # For bar chart

x = randn(100)  # For scatter plot

# Combine individual plots into a 2x2 layout
f = Figure()
barplot(f[1, 1], 1:4, sales, axis=(xticks=(1:4, categories), title="bar", xticklabelsize=10))
axis = Axis(f[1, 2], title="line")
lines!(f[1, 2], cumsum(x))
axis = Axis(f[2, 1], title="scatter")
scatter!(axis, x)
axis = Axis(f[2, 2], title="histogram")
hist!(axis, x)
f
  • Multivariate Visualizations: Heatmaps, parallel coordinates plots, radar charts, bubble charts.
    • Heatmaps are best for visualizing the intensity, interactions or relationships of values across two dimensions.
    • Bubble charts which are variants of scatter plots are best for showing relationships between three variables. One can easily highlight relative importance or magnitude using the size of bubbles (e.g., revenue, population).
    • Parallel coordinates plots are best for comparing multiple variables across different observations. They are often used for detecting patterns, correlations or relationships across multiple dimensions.
    • Radar charts are best for comparing multiple variables for a single or few observations, especially when one needs to show comparisons of several quantitative variables for one or more items, with each variable represented on an axis.
using Random, CairoMakie

Random.seed!(1234)

# Data for plots
# For heatmap
xs = range(0, π, length=10)
ys = range(0, π, length=10)
zs = [sin(x * y) for x in xs, y in ys]

bubble_x = rand(10) * 10
bubble_y = rand(10) * 10
bubble_size = rand(10) * 100

# Dummy data for radar chart
radar_data = [0.7, 0.9, 0.4, 0.6, 0.8]

# Dummy data for parallel coordinates plot
parallel_data = rand(10, 5)

f = Figure()

# Heatmap (1,1)
ax1 = Axis(f[1, 1], title="Heatmap")
heatmap!(ax1, xs, ys, zs)

# Parallel coordinates (1,2)
ax2 = Axis(f[1, 2], title="Parallel Coordinates")
for i in 1:size(parallel_data, 2)
    lines!(ax2, 1:size(parallel_data, 2), parallel_data[i, :])
end


# Radar Chart (2,1)
ax3 = Axis(f[2, 1], title="Radar Chart", aspect=1)
angles = range(0, 2π, length=length(radar_data) + 1)
r = [radar_data; radar_data[1]]
arc!(ax3, Point2f(0), 0.5, -π, π, color=:grey90)
arc!(ax3, Point2f(0), 1, -π, π, color=:grey90)
lines!(ax3, cos.(angles) .* r, sin.(angles) .* r, color=:green)
poly!(ax3, cos.(angles) .* r, sin.(angles) .* r, color=(:blue, 0.2))
scatter!(ax3, cos.(angles) .* r, sin.(angles) .* r, color=:red)
hidedecorations!(ax3)
hidespines!(ax3)

# Bubble Plot (2,2)
ax4 = Axis(f[2, 2], title="Bubble Plot")
scatter!(ax4, bubble_x, bubble_y, markersize=bubble_size, color=:orange, alpha=0.5)

f
  • Dimensionality Reduction: PCA plots, t-SNE, and UMAP for visualizing high-dimensional data. Here we show an example how high-dimensional data can be shown on a t-SNE plot.

Here we show an example to cluster synthetic stocks based on financial indicators like:

– Volatility – Momentum (6-month return) – Market Cap – P/E Ratio – Dividend Yield

t-SNE will reduce the dimensions and help us visualize clusters of stocks with similar characteristics.

using TSne, DataFrames, Random, Distributions, CairoMakie, StatsBase

# Generate synthetic financial dataset
Random.seed!(42)
num_stocks = 100

df = DataFrame(
    Stock=["Stock_$(i)" for i in 1:num_stocks],
    Volatility=rand(Uniform(10, 50), num_stocks),  # % annualized
    Momentum=rand(Uniform(-10, 30), num_stocks),   # 6-month return
    Market_Cap=1:num_stocks,  # in billion USD
    P_E_Ratio=rand(Uniform(5, 50), num_stocks),
    Dividend_Yield=rand(Uniform(0, 5), num_stocks) # in %
)

# Normalize features
features = [:Volatility, :Momentum, :Market_Cap, :P_E_Ratio, :Dividend_Yield]
X = Matrix(df[:, features])
X = StatsBase.standardize(ZScoreTransform, X, dims=1)  # Standardize data

# Apply t-SNE
tsne_result = tsne(X)

# Add t-SNE components to DataFrame
df.TSNE_1 = tsne_result[:, 1]
df.TSNE_2 = tsne_result[:, 2]

# A graph of somewhat randomly distributed but also small patterns of linearity.
Makie.scatter(df.TSNE_1, df.TSNE_2)
  • Time Series Visualization: Line charts, area charts, time-series decomposition plots. Refer to Chapter 20 for a time series plot.

  • Geospatial Visualization: Maps, choropleth maps for visualizing spatial data. Here we show how spatial data can be visualized using a choropleth map.

  • Interactive Dashboards: Tools like Tableau, Power BI, Pluto for interactive and dynamic data exploration.

18.5.1 Additional Examples

For more kinds of visualizations, see:

18.6 Julia Plotting Packages

Julia has several powerful packages for data visualization, each with different strengths depending on your needs (e.g., interactive vs. static plots, ease of use vs. customization). Each package has unique strengths depending on the use case, so the best choice depends on our specific needs, the type of data, and whether we need interactive or static visualizations. Below are some of the most common visualization packages in Julia:

18.6.1 CairoMakie.jl and GLMakie.jl

Makie is designed for high-performance, interactive, and 3D visualization. It supports real-time interaction and is highly customizable. It supports 2D and 3D plotting and real-time interactivity. It is also extremely fast with GPU acceleration for certain operations. CairoMakie is suitable for print-quality vector output, while GLMakie utilizes GPU acceleration for high quality 2D and 3D plots. CairoMakie was chosen as the tool for this book because it offers very sensible default behavior and aesthetics, is easy to customize, and generally straightforward code.

18.6.2 Plots.jl

Plots is one of the most versatile and popular Julia plotting libraries. It provides a high-level interface for different plotting backends (e.g., GR, Plotly, PyPlot, PGFPlotsX, etc.). It uses a high-level syntax that is easy to use. It supports multiple backends for both static and interactive plots, but can be more limited in its customization options.

18.6.2.1 StatsPlots.jl

StatsPlots extends Plots by adding statistical plot types such as boxplots, violin plots, histograms, and density plots. It’s ideal for users who frequently work with statistical data. It is specialized for statistical visualizations. It allows easy integration with Julia’s statistical packages like DataFrames and StatsBase.

18.6.3 GraphPlot.jl

This package is used to plot graphs (networks), such as social network visualizations or other graph-related problems. It supports integration with the LightGraphs package for graph analytics.

18.6.4 UnicodePlots.jl

UnicodePlots provides simple plotting capabilities in the terminal using Unicode characters, making it lightweight and fast. There are no external dependencies. It is great for quick plotting within the terminal.

18.7 References

Much of the principles and some of the examples are inspired by (Tufte 2001).